You can slash your monthly utility bills by 10% to 20% simply by knowing exactly which appliances are draining your budget, rather than waiting for the monthly statement to arrive as a surprise. If you are tired of playing the guessing game with your energy consumption, building an open-source energy dashboard is the most effective way to turn your home into a transparent, data-driven environment.
- Visibility equals savings: Real-time tracking allows you to identify “vampire” devices that consume power even when they appear to be off.
- Privacy first: Open-source platforms like Home Assistant keep your energy usage data local, ensuring that big utility companies or tech giants aren’t profiling your lifestyle.
- Actionable intelligence: You don’t just see numbers; you can automate your home to turn off high-draw devices when electricity prices peak or when rooms are empty.
Why Your Monthly Energy Bill is a Black Box
We’ve all been there: you open your electricity bill, stare at the total, and wonder how on earth it climbed so high. Was it the kids leaving the lights on? The old refrigerator in the garage? The HVAC system fighting a losing battle against a drafty window? When you receive a bill at the end of the month, you are looking at a historical record, not a tool for management. By the time you realize your consumption spiked, the money is already gone.
A smart-home energy dashboard changes this dynamic from “reactive” to “proactive.” Instead of seeing a lump sum, you see a breakdown. You can see that your dryer uses 3kWh per load, or that your media center draws 50 watts even when it’s “off.” This isn’t just about saving a few cents; it’s about understanding the mechanical heartbeat of your home. For parents in their 30s and 40s, this is often the difference between a sustainable household budget and one that feels constantly squeezed by rising utility costs.
What Exactly is an Open-Source Energy Dashboard?
At its core, an energy dashboard is a software interface that visualizes data from your home’s electrical system. “Open-source” means the software is community-developed, free to use, and—crucially—not locked into a specific manufacturer’s ecosystem. While companies like Google or Amazon offer smart home devices, they often trap you in their proprietary clouds. An open-source setup puts you in control of the data.
The system generally consists of three parts:
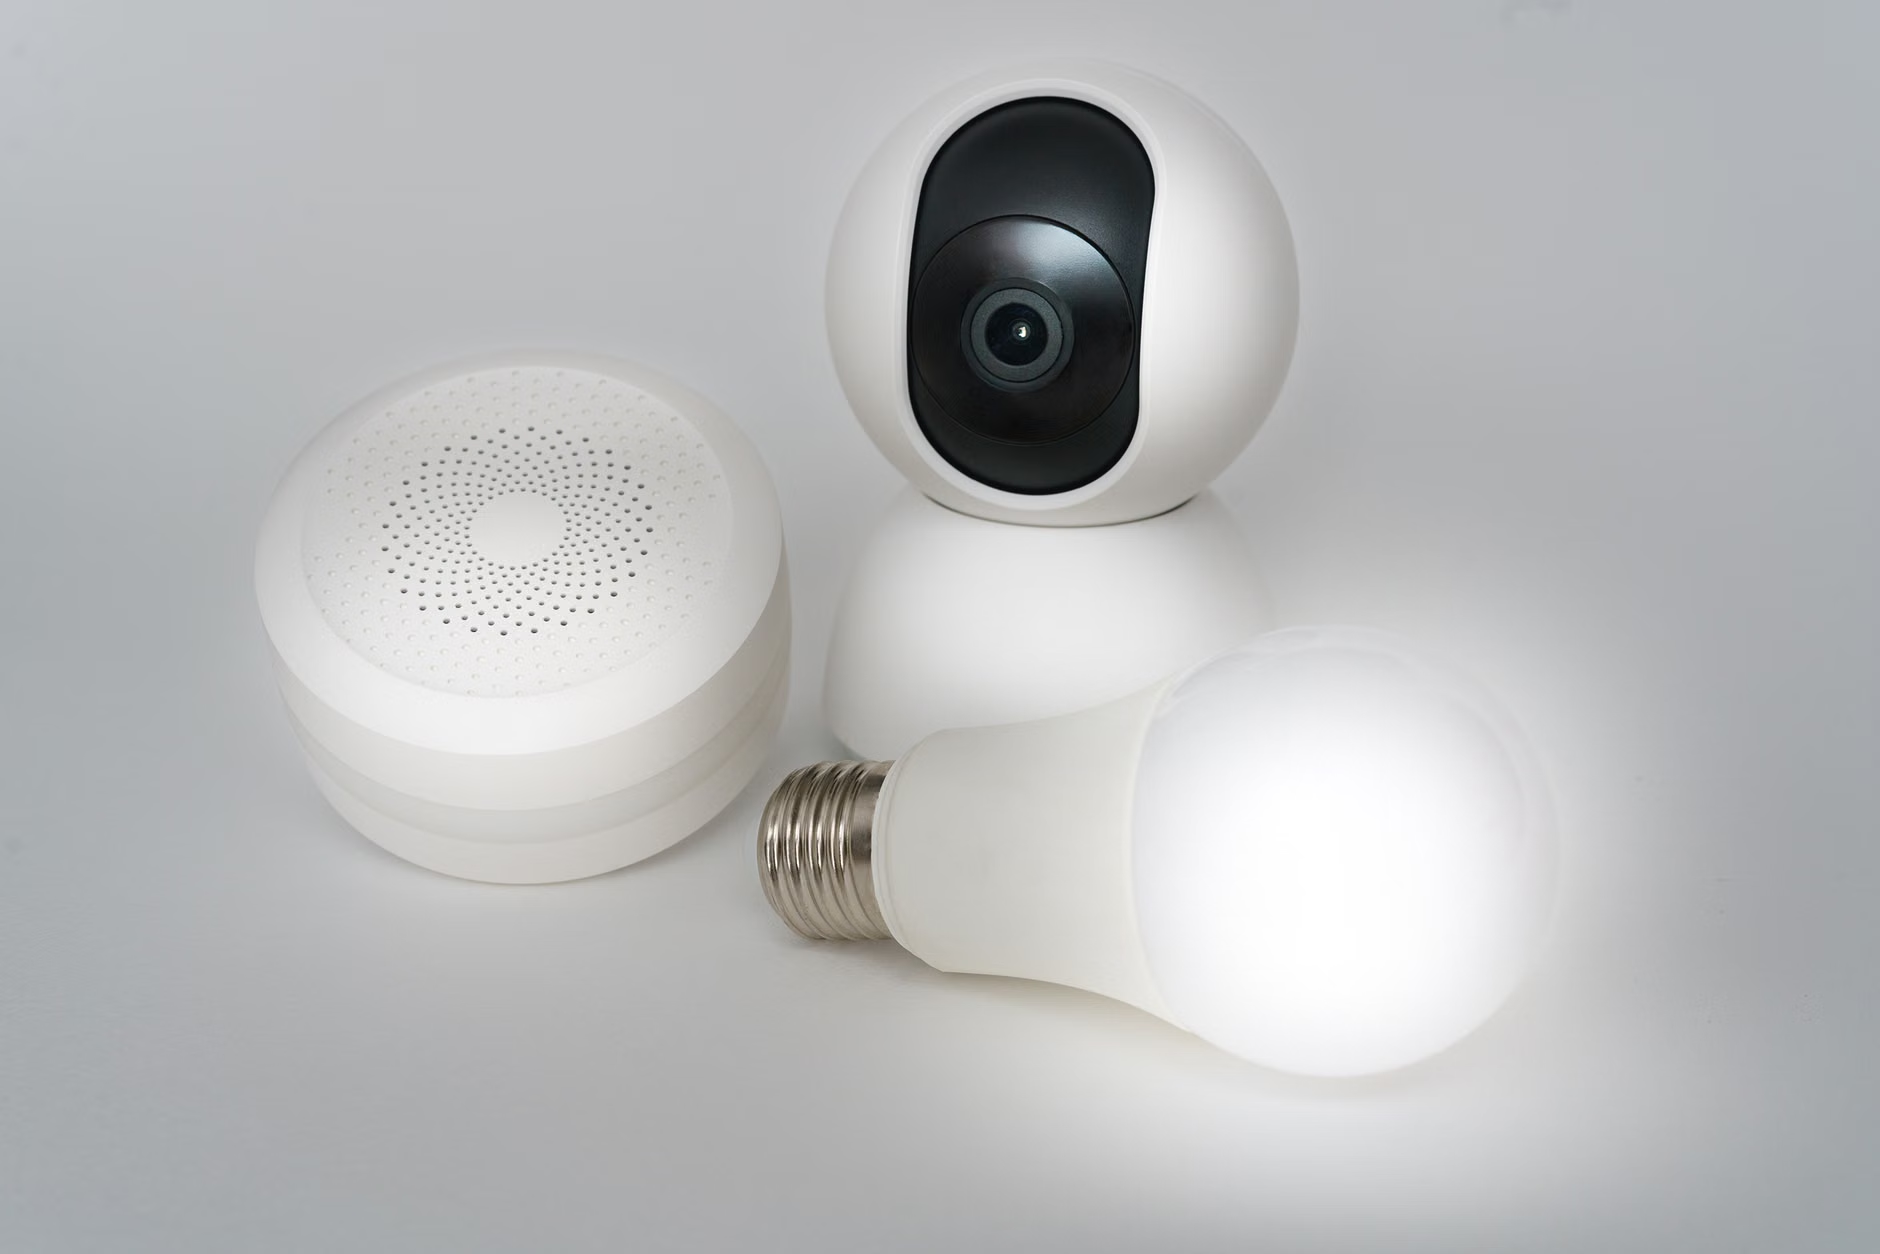
- The Hardware Sensor: A device like an energy monitor (e.g., Emporia Vue or Shelly EM) that clamps onto your main circuit breakers.
- The Hub: A small computer, like a Raspberry Pi or a repurposed mini-PC, running software like Home Assistant.
- The Interface: The dashboard itself, which you view on your phone, tablet, or a wall-mounted display.
The Hidden Costs and Benefits: A Comparative Look
Many people hesitate because they assume this is a project for electrical engineers. In reality, modern hardware has made this accessible to anyone comfortable with basic DIY tasks. However, it is vital to weigh the investment against the return.
| Feature | Proprietary Energy Apps | Open-Source Dashboard |
|---|---|---|
| Data Privacy | Cloud-based; data sold/analyzed | Local; 100% private |
| Customization | Limited to manufacturer presets | Infinite; build your own views |
| Cost | Monthly subscription fees | One-time hardware cost |
| Learning Curve | Low (Plug and play) | Moderate (Requires setup) |
The “hidden” cost of proprietary systems isn’t just the sticker price; it is the recurring subscription fee and the loss of data ownership. An open-source system requires a higher initial time investment—perhaps a weekend of tinkering—but it pays off in long-term flexibility and security.
Step-by-Step: Moving from Frustration to Data-Driven Living
If you decide to take the plunge, don’t try to do everything at once. Start with the “low-hanging fruit” of energy monitoring.
Step 1: Choose Your Hardware Wisely
Look for devices that communicate via local protocols like MQTT or local APIs. Avoid devices that force you to use a Chinese or American cloud server to see your data. The goal is to ensure that if the internet goes down, your dashboard keeps working.
Step 2: Install the Hub
Most enthusiasts use Home Assistant. It is the gold standard for open-source home automation. You can run it on a Raspberry Pi 4 or 5, or even on a spare laptop. It acts as the brain that collects data from your energy monitor and turns it into beautiful charts.
Step 3: Map Your Circuits
This is where the magic happens. Once you have your monitor installed, label your circuits. Don’t just track “Total Usage.” Track “HVAC,” “Kitchen,” and “Master Bedroom.” When you see that your HVAC is cycling every 15 minutes, you might realize your air filter is clogged—a discovery that saves you from a costly repair bill later.
Real-Life Scenarios: Why This Matters for Parents
Imagine it’s a Tuesday afternoon. You’re at work, and your partner is at home with the kids. You get a notification on your phone: “High energy usage detected in the laundry room.” You check the dashboard and realize the dryer has been running for three hours. A quick text message solves the problem. Or, perhaps you’re planning a family vacation. By checking your historical energy baseline, you can identify exactly what “base load” your house consumes and potentially lower it by turning off specific circuits before you leave.
For parents, the most significant benefit is predictability. You no longer have to explain to your spouse why the bill is $50 higher than expected; you have the data to point to the specific week, or even the specific day, when usage spiked. You can turn energy management into a family game—who can keep the energy usage below a certain threshold for the week? It’s a practical way to teach children about conservation without being overly preachy.
Common Mistakes to Avoid
The most common mistake beginners make is over-complicating the dashboard. You do not need 50 different graphs on one screen. Start with three: Total Power (Real-time), Daily Cost, and Top Consumers. If your dashboard looks like a NASA control panel, you’ll stop looking at it within a week. Keep it clean, keep it readable, and focus on the information that actually leads to a change in behavior.
Another mistake is ignoring safety. When you are installing clamps inside your breaker panel, you are dealing with live electricity. If you are not 100% comfortable with this, hire a licensed electrician to perform the installation of the hardware. The software part is where you can safely experiment and learn.

The Long-Term Insight: Energy as a Managed Asset
Beyond just saving a few dollars, an open-source energy dashboard prepares you for the future of energy. As we see more homes adopting solar panels, battery storage, and electric vehicles, the “grid” is becoming more complex. Utility companies are increasingly moving toward Time-of-Use (TOU) pricing, where electricity costs more during peak hours (usually late afternoon).
With an open-source dashboard, you can automate your home to respond to these prices. For example, you can set your EV charger to only draw power after midnight when rates are lowest, or program your smart thermostat to pre-cool the house during off-peak hours. This is the future of home management, and by building your own dashboard today, you are future-proofing your home against rising and volatile energy costs.
Final Thoughts
Building an energy dashboard isn’t just a tech project; it’s an act of taking control. In a world where costs for basic necessities seem to climb indefinitely, having the ability to monitor, analyze, and automate your home’s consumption is a superpower. Start small, prioritize local control, and focus on the data that helps you make better decisions for your family’s budget and the planet.
If you are ready to get started, the Home Assistant community is your best resource. Start by reading their official documentation on energy monitoring.
Official Resources:
Frequently Asked Questions
1. Do I need to be a programmer to set this up?
No. While some basic technical troubleshooting is helpful, modern open-source platforms like Home Assistant have user-friendly interfaces. You will mostly be clicking through menus, not writing code.
2. Is this safe for my home network?
Yes, especially because you are keeping the data local. Since the data doesn’t leave your home, you aren’t reliant on a third-party server that could be hacked. Just ensure your home Wi-Fi is secured with a strong password.
3. How much should I expect to spend on hardware?
For a basic setup, you can expect to spend between $100 and $200 for a quality energy monitor and a Raspberry Pi (or similar mini-PC). Given that this can help you identify significant savings, many users find the project pays for itself within the first year.
Take the first step today: identify which room in your house you suspect is the biggest energy hog, and see if you can find a way to monitor it this month.